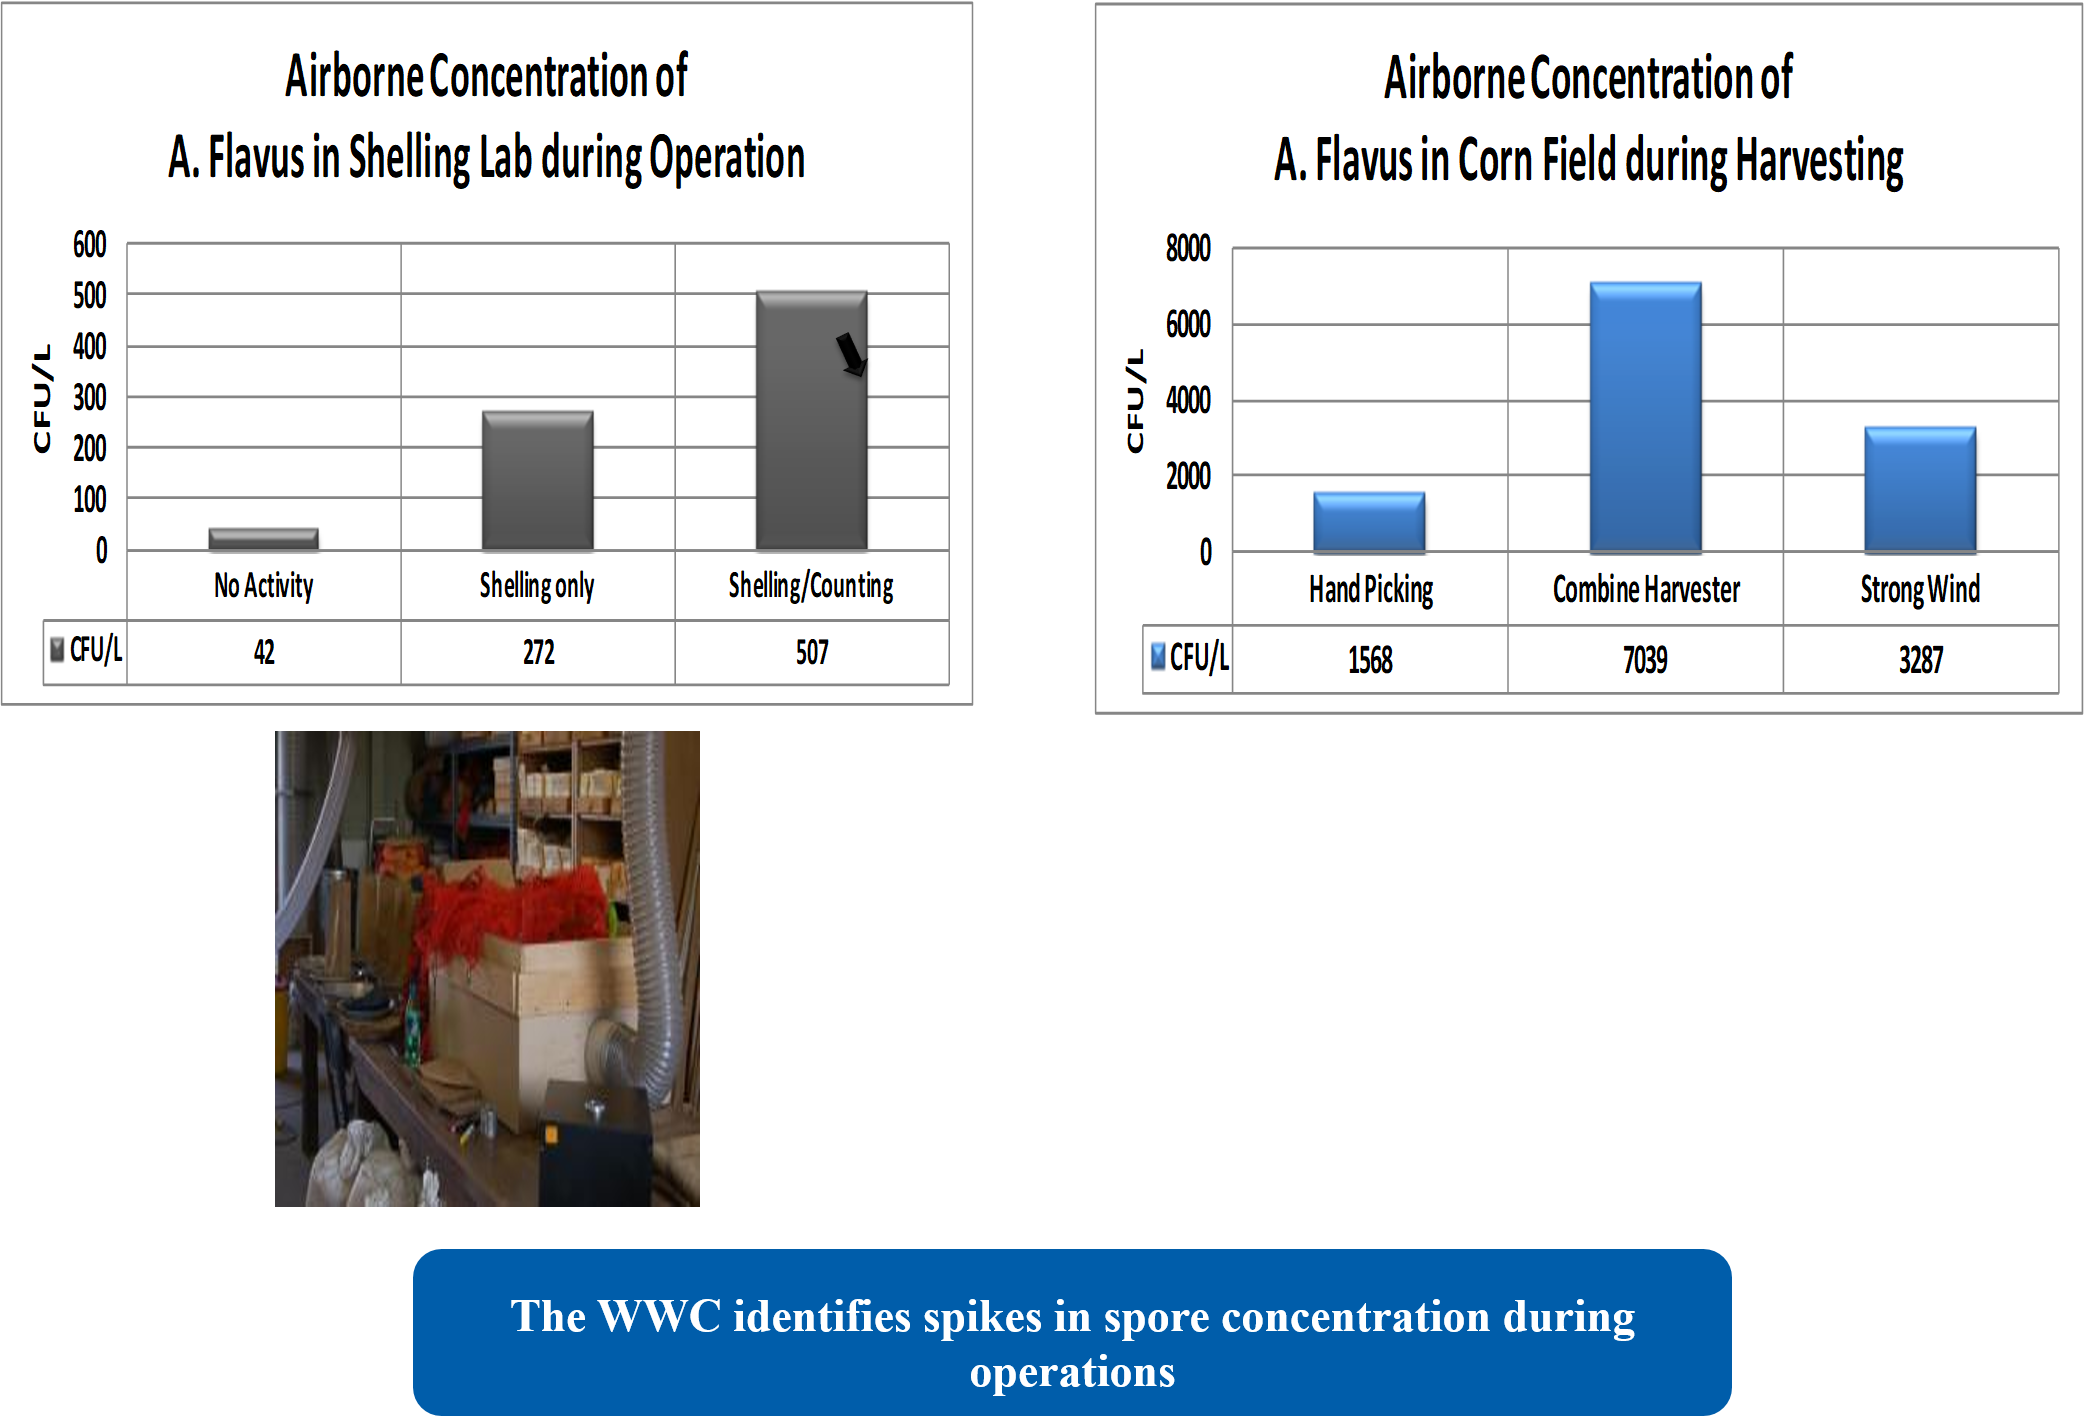
corn graphs October 1, 2018 by jschaeffer Two graphs of the airborne concentration. Two photos on right show corn field and with the tester and the tester in the lab.